How to Excel Data Table: Creating and Utilizing Efficiently
In today’s fast world, knowing how to use Excel Data Tables is key. They help you manage and analyze data well. But, some users face problems like locked cells or slow speeds.
Learning about Data Tables can make your work better. It can make your reports more detailed and your data analysis stronger.
This article will teach you the basics of Data Tables. We’ll talk about their benefits and how to use them right. Let’s learn how to improve our data management skills!
Understanding Excel Data Tables
Excel data tables are great for deep analysis. They help see how changes affect results. This is key for making smart choices and testing ideas.
What is a Data Table in Excel?
A data table in Excel is a special area for calculations. It can handle one or two input values. This lets users test many scenarios easily.
Benefits of Using Data Tables
Data tables make complex tasks simple. They let you test many values at once. This makes data easier to sort and filter, helping find important trends.
Common Use Cases for Data Tables
Data tables are very useful in finance. They help analyze things like EBITDA by changing assumptions. They also help make better decisions by testing different scenarios.
| Type of Data Table | Description | Maximum Input Cells |
|---|---|---|
| One-variable | Tests various values for a single input cell to show outcome changes. | 1 input cell |
| Two-variable | Compares combinations of two variable values and their effect on a single formula result. | 2 input cells |
Creating a Data Table in Excel
Creating a data table in Excel makes analyzing and presenting data easier. This guide will show you how to build a good data table. You’ll learn about formatting and organizing your data for better use and clarity.
Step-by-Step Guide to Create a Data Table
To start, organize your data first. Make sure all important info is in one place. Then, pick your data range, including the headers.
Go to the “Insert” tab and click “Table”. Excel will turn your data into a table. This table will have filters and formats automatically. For example, a data table with one variable can show how sales affect profits.
Formatting Your Data Table
Formatting your data table is key for easy reading and looking good. After making your table, use the Table Tools design tab. Pick styles to make it look better.
You can also change column widths or merge cells for headers. Using colors helps spot different data types fast. Keeping your table clean is also important, especially when cleaning data in Excel.
Tips for Data Entry and Organization
Good data entry is essential. Start by making rules for entering data. Use dropdown lists for standard entries. Check your data often to catch mistakes.
Make sure column and row names are clear. This makes it easier to find what you need. If you’re using advanced Excel formulas, make sure to link cells right. Finally, always check your data to keep it accurate, especially when cleaning it in Excel.
Analyzing Data through Excel Tables
Excel has many tools for easy data analysis. Its tables help you work with data fast. This makes it easier to find important insights.
Using Table Features for Analysis
Excel tables offer cool features like calculated columns and filters. These make data cleaning easy. For example, tables update formulas when new data comes in.
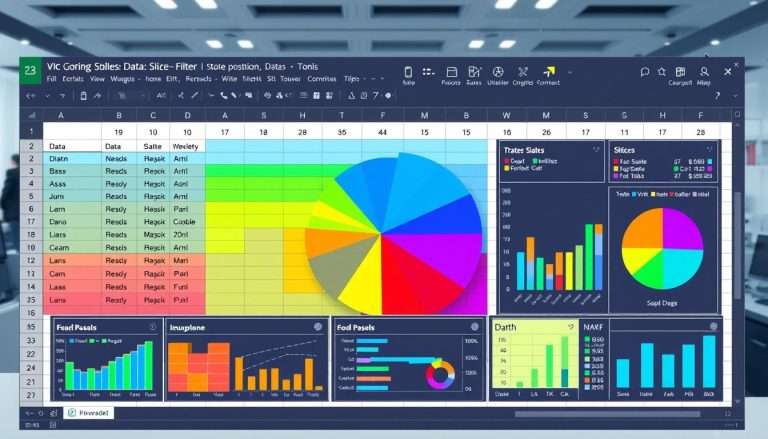
Features like slicers make it simple to get the data you need. This helps you understand your data better.
Filtering and Sorting Options
Filtering and sorting help you see what’s important. Excel’s filters make it easy to find specific data. Sorting lets you compare data easily.
This makes it simple to work with lots of data. You can find trends and patterns without getting lost.
Creating Pivot Tables from Data Tables
Pivot tables are a big deal in Excel. They help you summarize and analyze data deeply. To make a pivot table, just pick your data and use Excel’s tools.
This gives you a detailed look at your data. It’s great for reports and understanding complex data.

Learning these tools makes you better at using Excel. It helps you make smart choices with clear data. For more info, check out Excel’s analyzing capabilities.
Enhancing Tables with Formulas and Functions
To make your Excel data tables better, using formulas and functions is key. We use important formulas to make calculations easier and tables more useful. Functions help us do math automatically, saving time on boring tasks.
Adding charts to data tables makes the data look good and easy to understand. Excel VBA macros also help with big datasets, making work easier.
Essential Formulas for Data Tables
Excel is great for using formulas in data tables. The =SUM formula adds up numbers in columns, helping with data analysis. Structured reference formulas make formulas work the same way in every row.
When you type formulas in a table column, it creates a new column that updates itself. This makes changing data easier.
Using Functions to Automate Calculations
Excel has over 400 functions for different tasks. Functions like SUM, AVERAGE, and MAX make math in tables easy. Lookup functions like VLOOKUP help find data in big datasets.
Tools like Formula Auditing help fix common errors. Using the right syntax and references keeps data management smooth.
Integrating Charts with Data Tables
Using Excel charts and graphs makes data easier to understand. Charts linked to data tables update automatically, saving time. This makes analyzing data more precise.
Excel VBA macros can also make your work more efficient. They offer custom solutions for specific tasks.

Best Practices for Managing Excel Data Tables
We will talk about the best ways to manage Excel data tables. Keeping your data tables up to date and organized is key. It makes them more useful and helps your team work better together.
Regular updates and maintenance are very important. A well-kept data table helps with analysis and reduces mistakes.
Regular Maintenance and Updates
Keeping your Excel data tables accurate and up to date is crucial. Check your data often and update it when needed. Use clear names for your sheets, like “SalesData” or “ExpenseReport.”
Apply Data Validation rules to keep your data consistent. Make sure your table covers all your data. You can always add more when you get new data.
Collaborating and Sharing Data Tables
Sharing and working together on data tables is important today. Tools like Airrange help by offering features like Kanban boards and interactive views. This makes tracking and managing data easier.
When you share data, protect it well. Use Excel’s built-in features to keep your data safe. Working with Microsoft Teams helps you communicate better and work together on projects.
Troubleshooting Common Issues
Fixing common problems in Excel data tables is important. Make sure your table has all the data. If issues come up, you can go back to a normal list range.
Don’t use merged cells to avoid problems. By following these tips, you can make your Excel data tables better and more reliable.


